Graph data with Grafana
This section is optional. Using Grafana, you can read the Redis database and graph it. Only the emulated deployment with QEMU will be detailed here, but grafana can be used with a real board too.
Prerequisites
Redis configuration
The grafana service will be running on the host. In order to make it work, it is compulsory to modify Redis configuration’s file on target. There are two ways to do this:
- Start the service with another config file given with the package
industrial-demo-config - Modify Redis configuration file in
/etc/redis.confevery time you start a new session on target
First method
First, stop Redis service:
systemctl stop redis
Then, start Redis with the new configuration file:
redis-server /etc/gateway/redis.conf
Second method
sudo vim /etc/redis.conf
There are two lines to change:
- l-69: change
bind 127.0.0.1tobind 0.0.0.0 - l-88: change
protected-mode yestoprotected-mode no
Then, restart the Redis service:
systemctl restart redis
QEMU configuration
Since Grafana will be installed on the host, we have to forward Redis’ port when QEMU is started. If you use Redis default port (6379), use this new command to start QEMU:
# For Ubuntu
OVMF="/usr/share/qemu/OVMF.fd"
# Uncomment/change for Fedora
#OVMF="/usr/share/OVMF/OVMF_CODE.fd"
# Uncomment/change for openSUSE
#OVMF="/usr/share/qemu/ovmf-x86_64-4m.bin"
PORT_SSH=3333

qemu-system-x86_64 \
    -hda "Redpesk-OS.img" \
    -enable-kvm -m 2048 \
    -cpu kvm64 \
    -cpu Skylake-Client-v4 \
    -smp 4 \
    -vga virtio \
    -device virtio-rng-pci \
    -serial mon:stdio \
    -serial null \
    -soundhw hda \
    -net nic \
    -net user,hostfwd=tcp::$PORT_SSH-:22,hostfwd=tcp::6379-:6379 \
    -bios $OVMF
Note that, by default redpesk has a firewall enabled that would block incoming connections to TCP/6379. You could either enable incoming connections in redpesk’s firewall or use an SSH connection to the virtual machine to forward the Redis’ port.
In order to change redpesk firewall’s configuration, use the following for a temporary configuration:
sudo firewall-cmd --zone=public --add-port=6379/tcp
Or, for a permanent configuration:
sudo firewall-cmd --add-port 6379/tcp --permanent
sudo firewall-cmd --reload
In order to open an SSH tunnel to the Redis’ port:
ssh -L 6379:localhost:6379 root@localhost -p $PORT_SSH
Grafana installation
In this demo, we will install Grafana natively. You can find further information here.
Installing on Debian
On a native Debian or Ubuntu system:
sudo apt-get install -y apt-transport-https
sudo apt-get install -y software-properties-common wget
wget -q -O - https://packages.grafana.com/gpg.key | sudo apt-key add -
Then, add this repository for stable releases:
echo "deb https://packages.grafana.com/oss/deb stable main" | sudo tee -a /etc/apt/sources.list.d/grafana.list
After you add the repository:
sudo apt-get update
sudo apt-get install grafana
Start the service:
sudo systemctl restart daemon-reload
sudo systemctl start grafana-server
Installing on Fedora
sudo dnf install grafana
sudo systemctl start grafana-server
Installing on OpenSUSE
sudo zypper install grafana
sudo systemctl start grafana-server
Grafana configuration
You can access to gafana UI on localhost:3000, default username and password are admin.
Install the Redis plugin
Go to Configuration > Plugins, and install the plugin named redis.
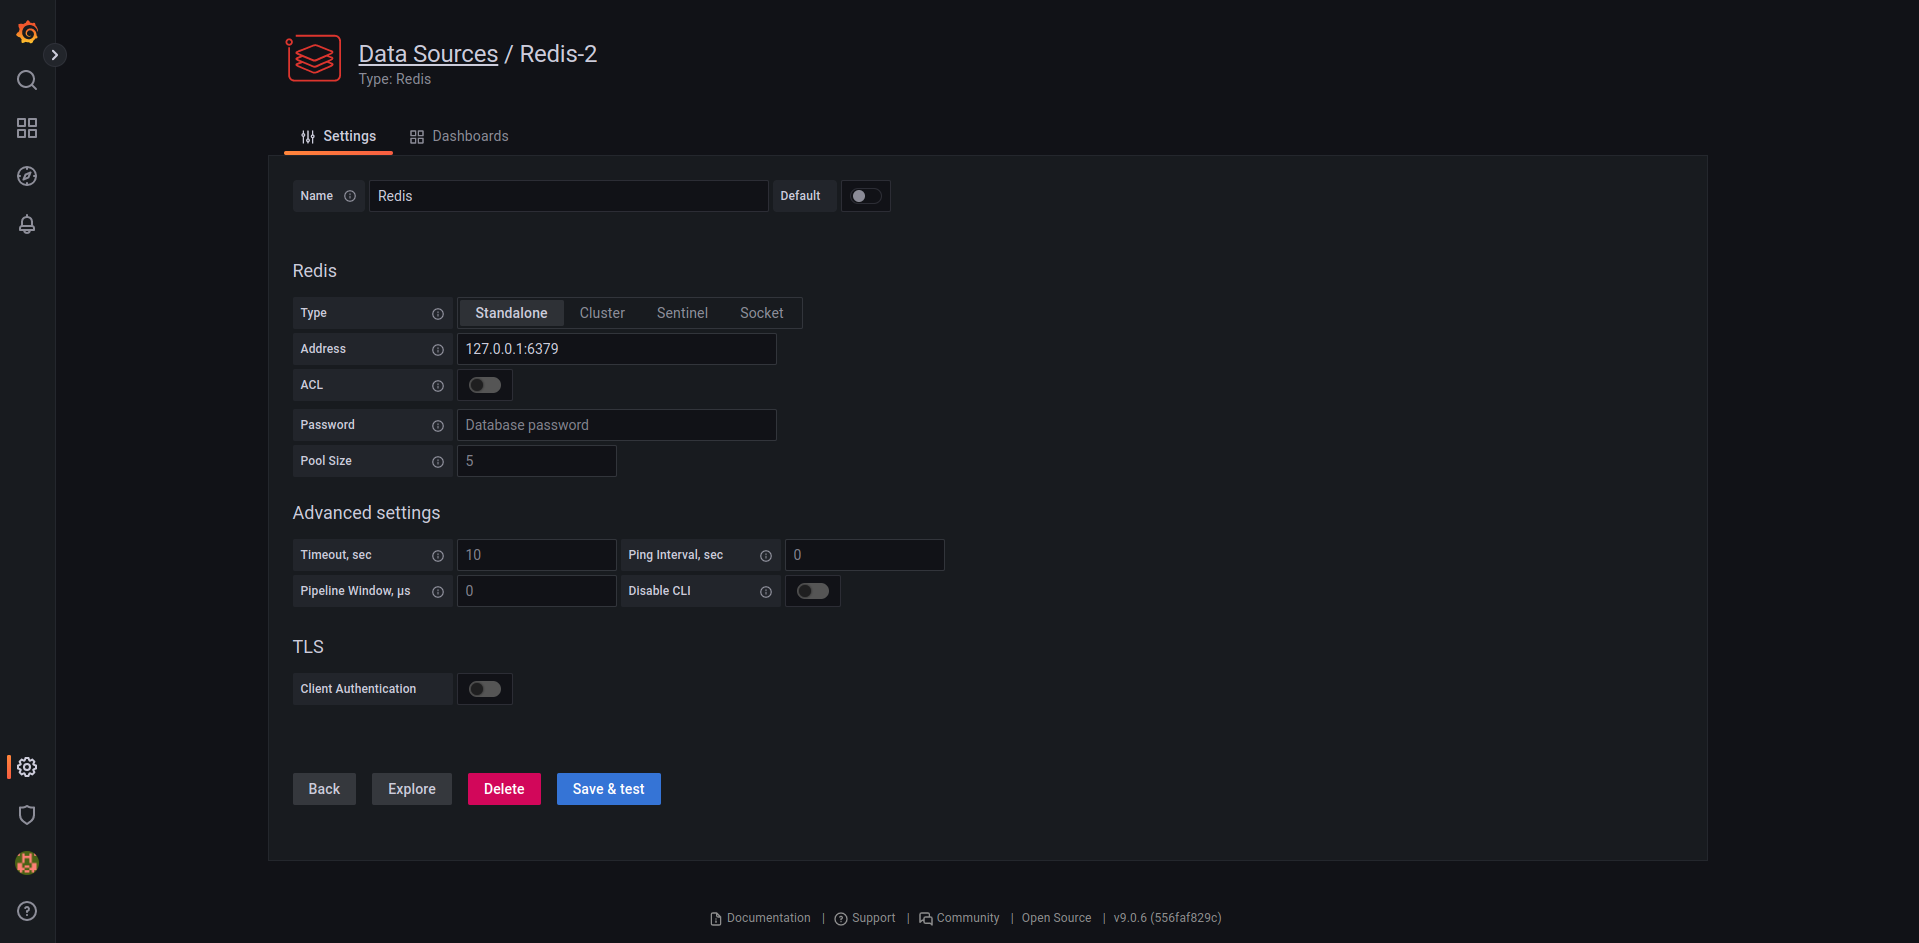
Add a data source
In Configuration > Data sources, click on add data source and select redis. You should get a configuration like this (you just have to put 127.0.0.1:6379 for the address):
Add a dashboard
Now that the database is added, let’s create a dashboard. You can either create one or use a configuration created for the demonstration.
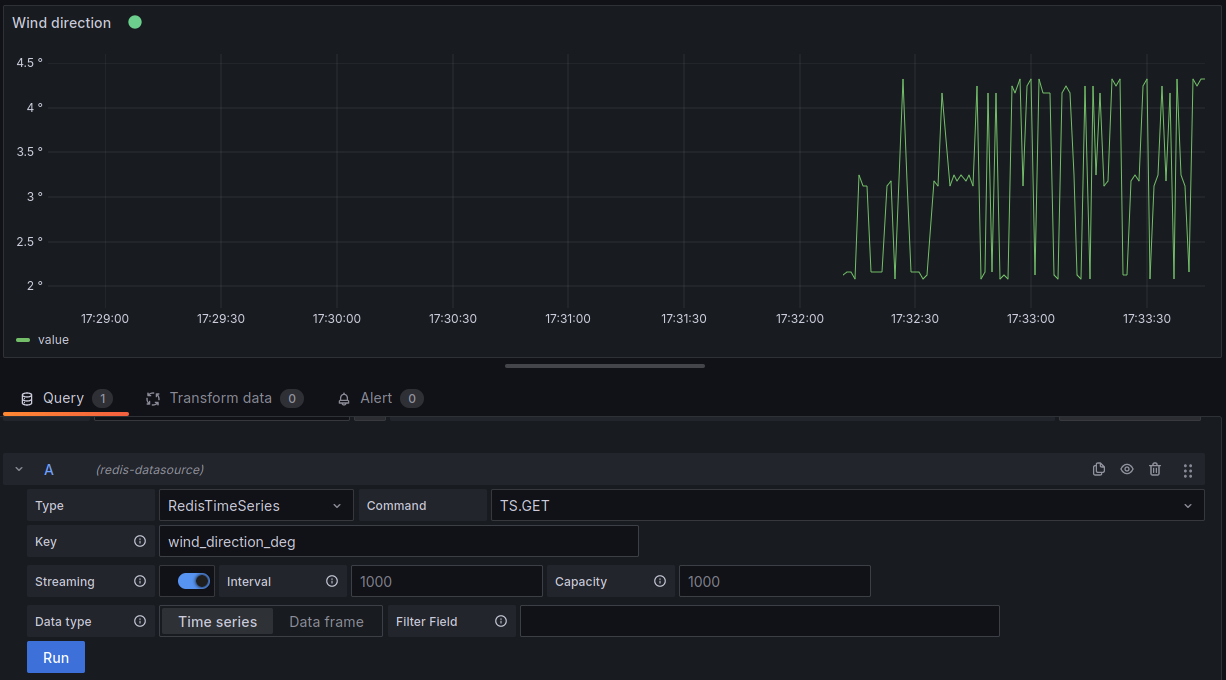
The dashboard should use the Redis datasource and use a query to redis through TS.GET on the key wind_direction_deg. Make sure the data is refresh every second by setting a streaming interval of 1000 ms.
The configuration file is available with this command:
wget https://github.com/redpesk-samples/anemometer-industrial-demo/-/raw/master/configs/grafana_config.json
In the grafana UI, go to Dashboards > Import, and upload this file.
Results
There we go, the demo is deployed and the data are on a grafana dashboard.